
Grafana and Prometheus Node Exporter
There is a long list of reasons for adopting the Grafana dashboards.Grafana dashboards are great instruments for obtaining insight into information from time series data. Furthermore, Grafana can easily integrate sensors, system and network metrics with InfluxDB and Telegraf to facilitate and provide much better information.
It's simple to set up and integrate a Grafana dashboard with different information sources. Grafana template variables allow you to generate dynamic dashboards for real-time modifications.
For someone who wants to monitor their local servers, Grafana needs additional services attached, say Prometheus which I have integrated with my own home server. Prometheus + Grafana is a common combination of tools to build up a monitoring system.
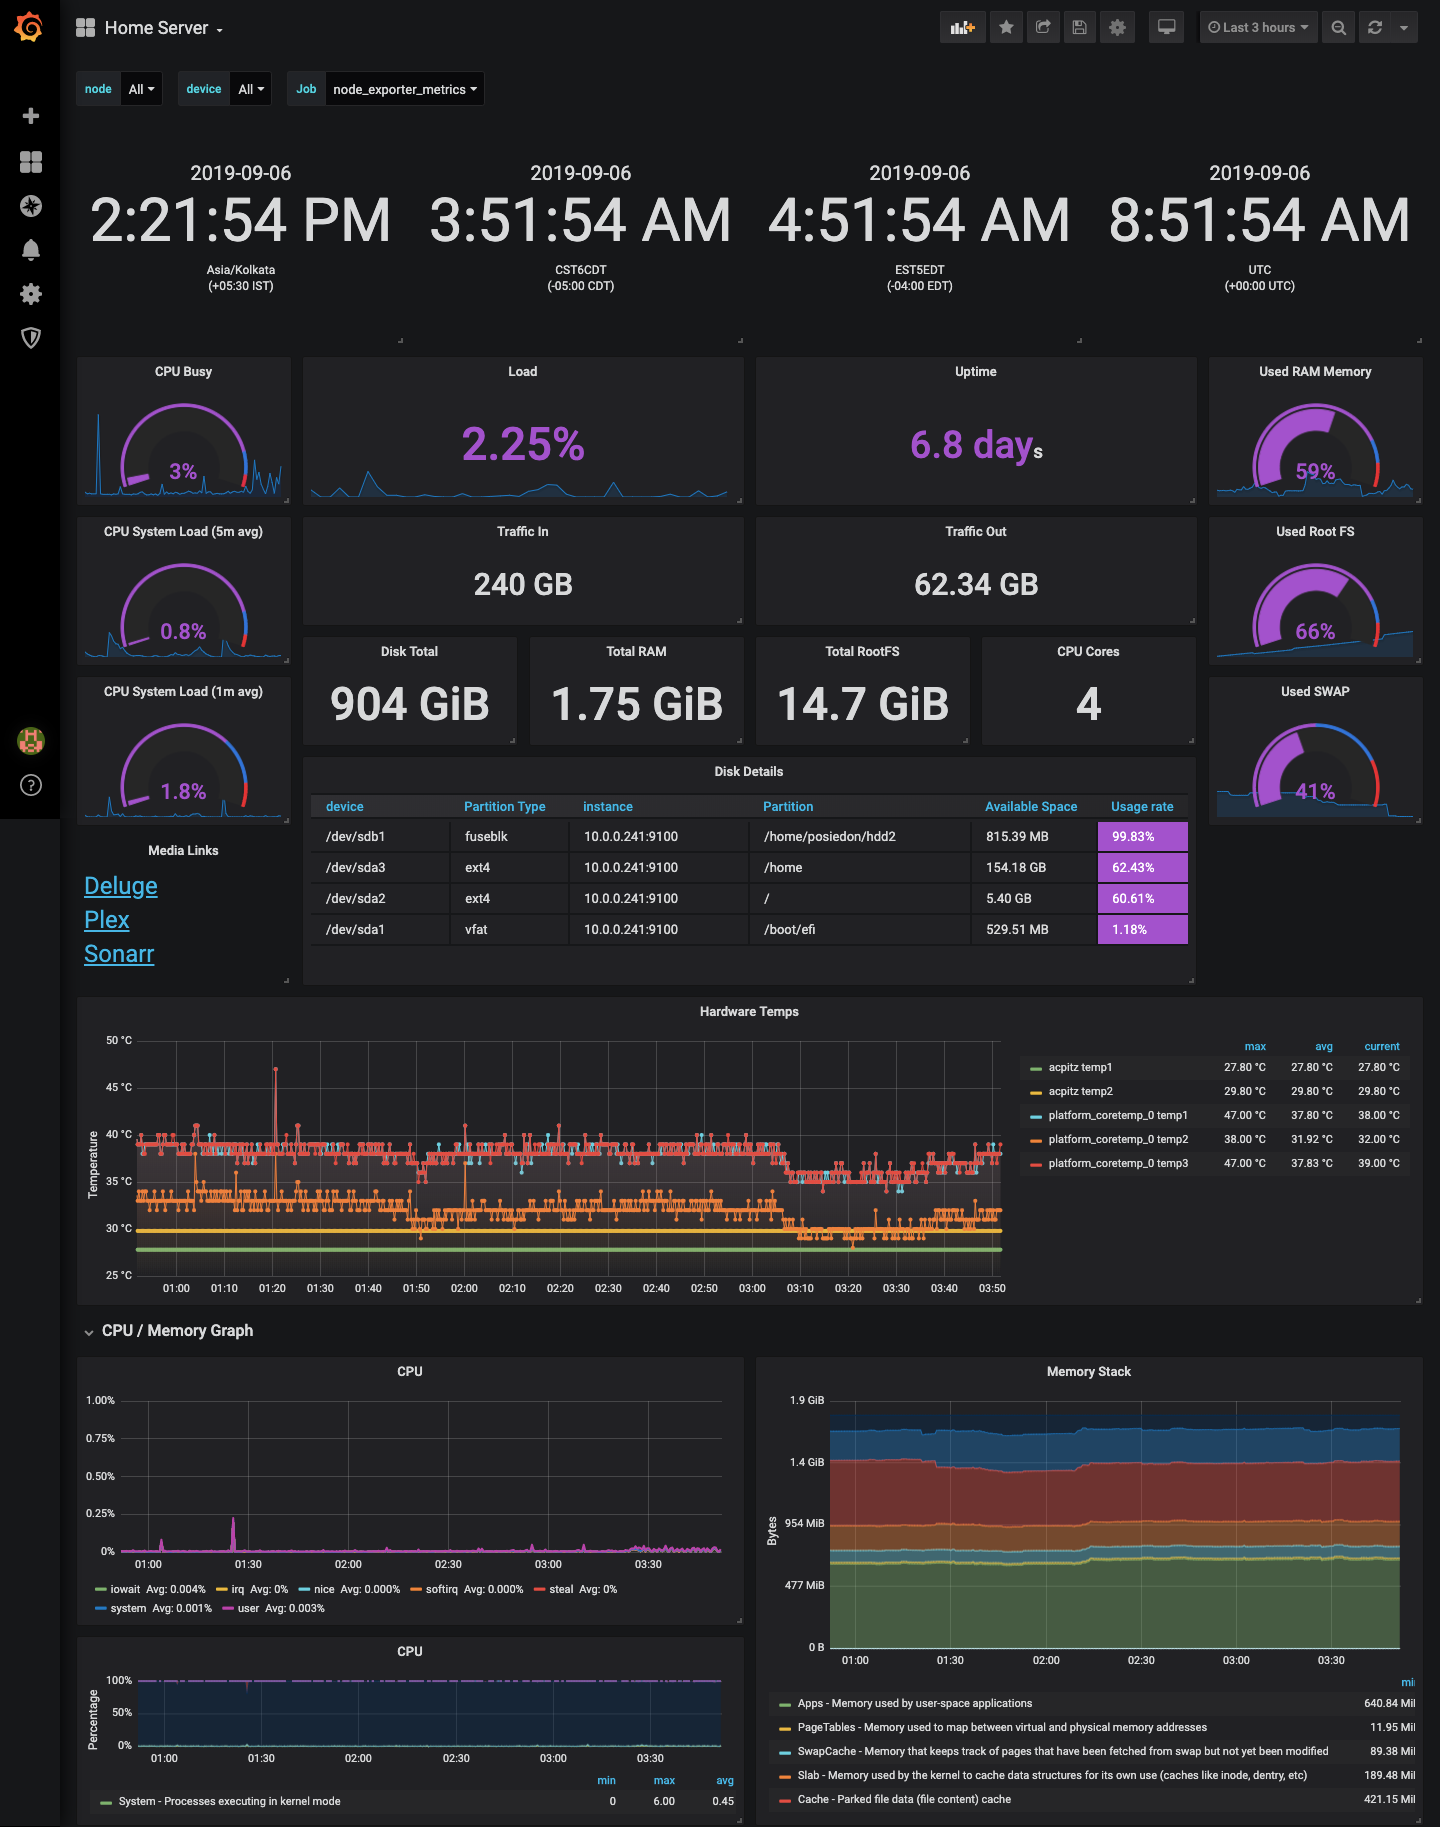
Here is a gallery of my current dashboard -
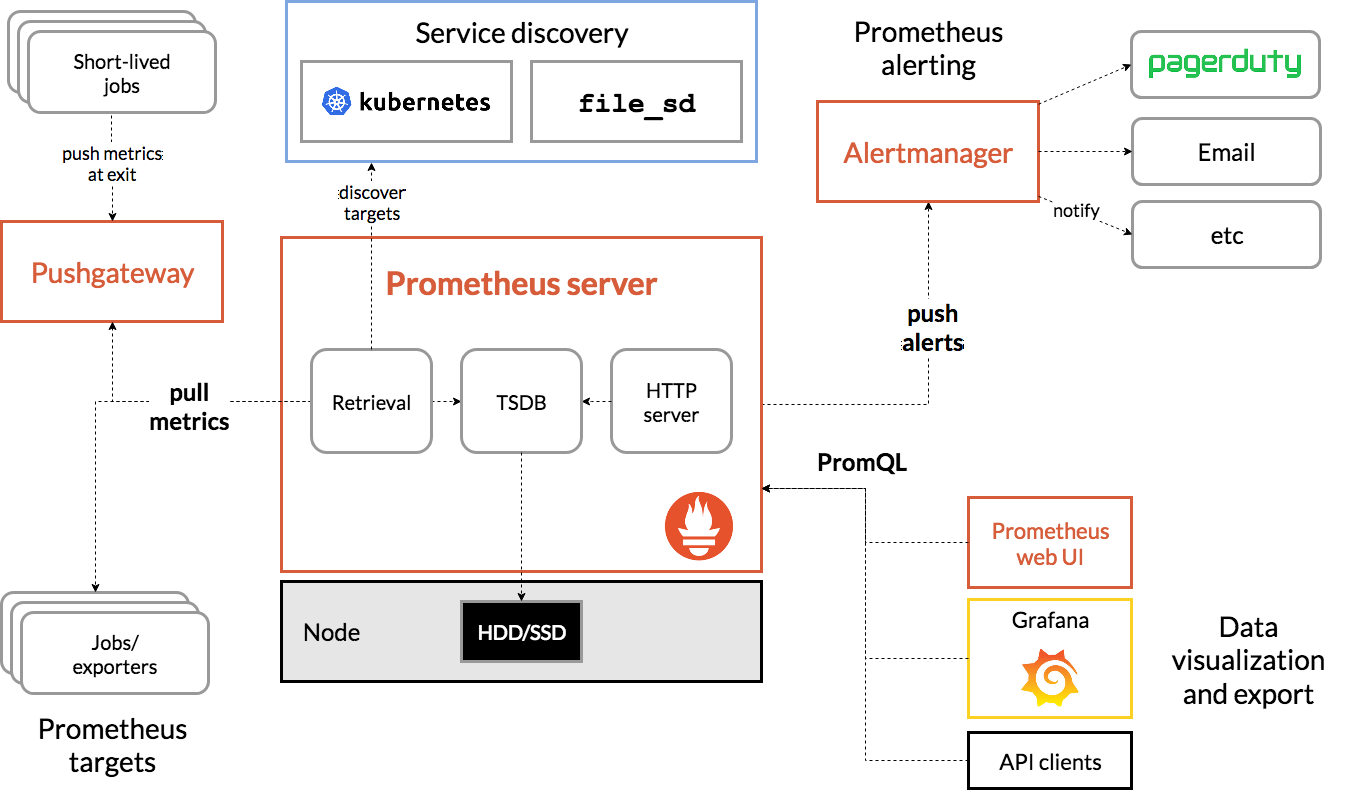
Under the Hood of Prometheus
Soundcloud developed Prometheus after migrating its operations over to Kubernetes. It is written in Go, with no external dependencies, as a static binary.
Flashbacks of 8085 microprocessor, anyone?
Prometheus allows users to query, log, and analyze data, but not in the way traditional analysis works. By identifying streams of data as key-value pairs, Prometheus aggregates and filters specified metrics while allowing for finely-grained querying to take place. Prometheus has a flexible query language allows querying and graphing this data.